Computer Installation Notes
3. Algorithms and Data structures
3.2. Flowchart
A flowchart is a diagrammatic or symbolic representation of step-by-step solution to a given problem. Flowcharts use standard symbols that help programmers visualize input, processing and output operations to be performed by a computer program. Unlike natural languages and pseudocode, use of standardised symbols makes the flowcharts easier to interpret hence more universally acceptable. Table 7.1 below gives a brief description of six standard symbols used to create flowcharts.
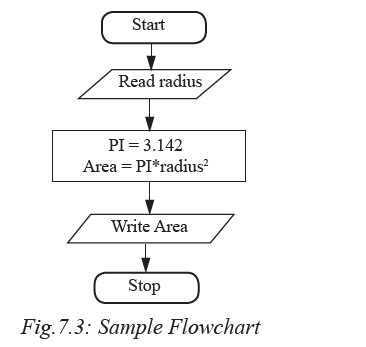
The example shown in Fig. 7.3 depicts a flowchart that takes radius as input
to calculate and display area of a circle.
Explanation
1. The first symbol indicates start of the flowchart.
2. The parallelogram (second symbol) indicates the algorithm takes radius as input.
3. The rectangle indicates that:
(i) Pi is assigned constant 3.142
(ii) The area is calculated as Pi × radius2
4. The fourth box display Area as output
5. The last symbol is the exit.
The following are general rules that may be followed when expressing an algorithm
using flowchart:
1. Be sure to use the right symbol for the right purpose. For examples it is wrong
to use a terminal symbol for input.
2. All the symbols of a flowchart should be connected using arrows (flow lines)
and not plain lines.
3. The direction of flow should be from top to bottom, or sides depending on the
page layout.
4. The start and end of a flowchart must be indicated with (start/stop) terminal
symbol.
5. Flowchart should have only one entry point at the top and one exit point at the
bottom or side.
6. The decision symbol should have only two exit points for either true or false
on the sides, or bottom and one side.
7. If a flowchart does not fit one page or column, use connectors to indicate breaks
in the flowchart
Advantages of using flowcharts
The following are some the advantages of using flowcharts to express an algorithm:
1. Flowcharts are better way of communicating the system logic.
2. With a flowchart, problem can be analysed in a more effective way.
3. Graphical representation of design serves as good program documentation.
4. Flowchart makes it easier to debug and maintain a program.
Activity 7.3: Expressing algorithm using flowcharts